Who am I actually competing with in AI search?
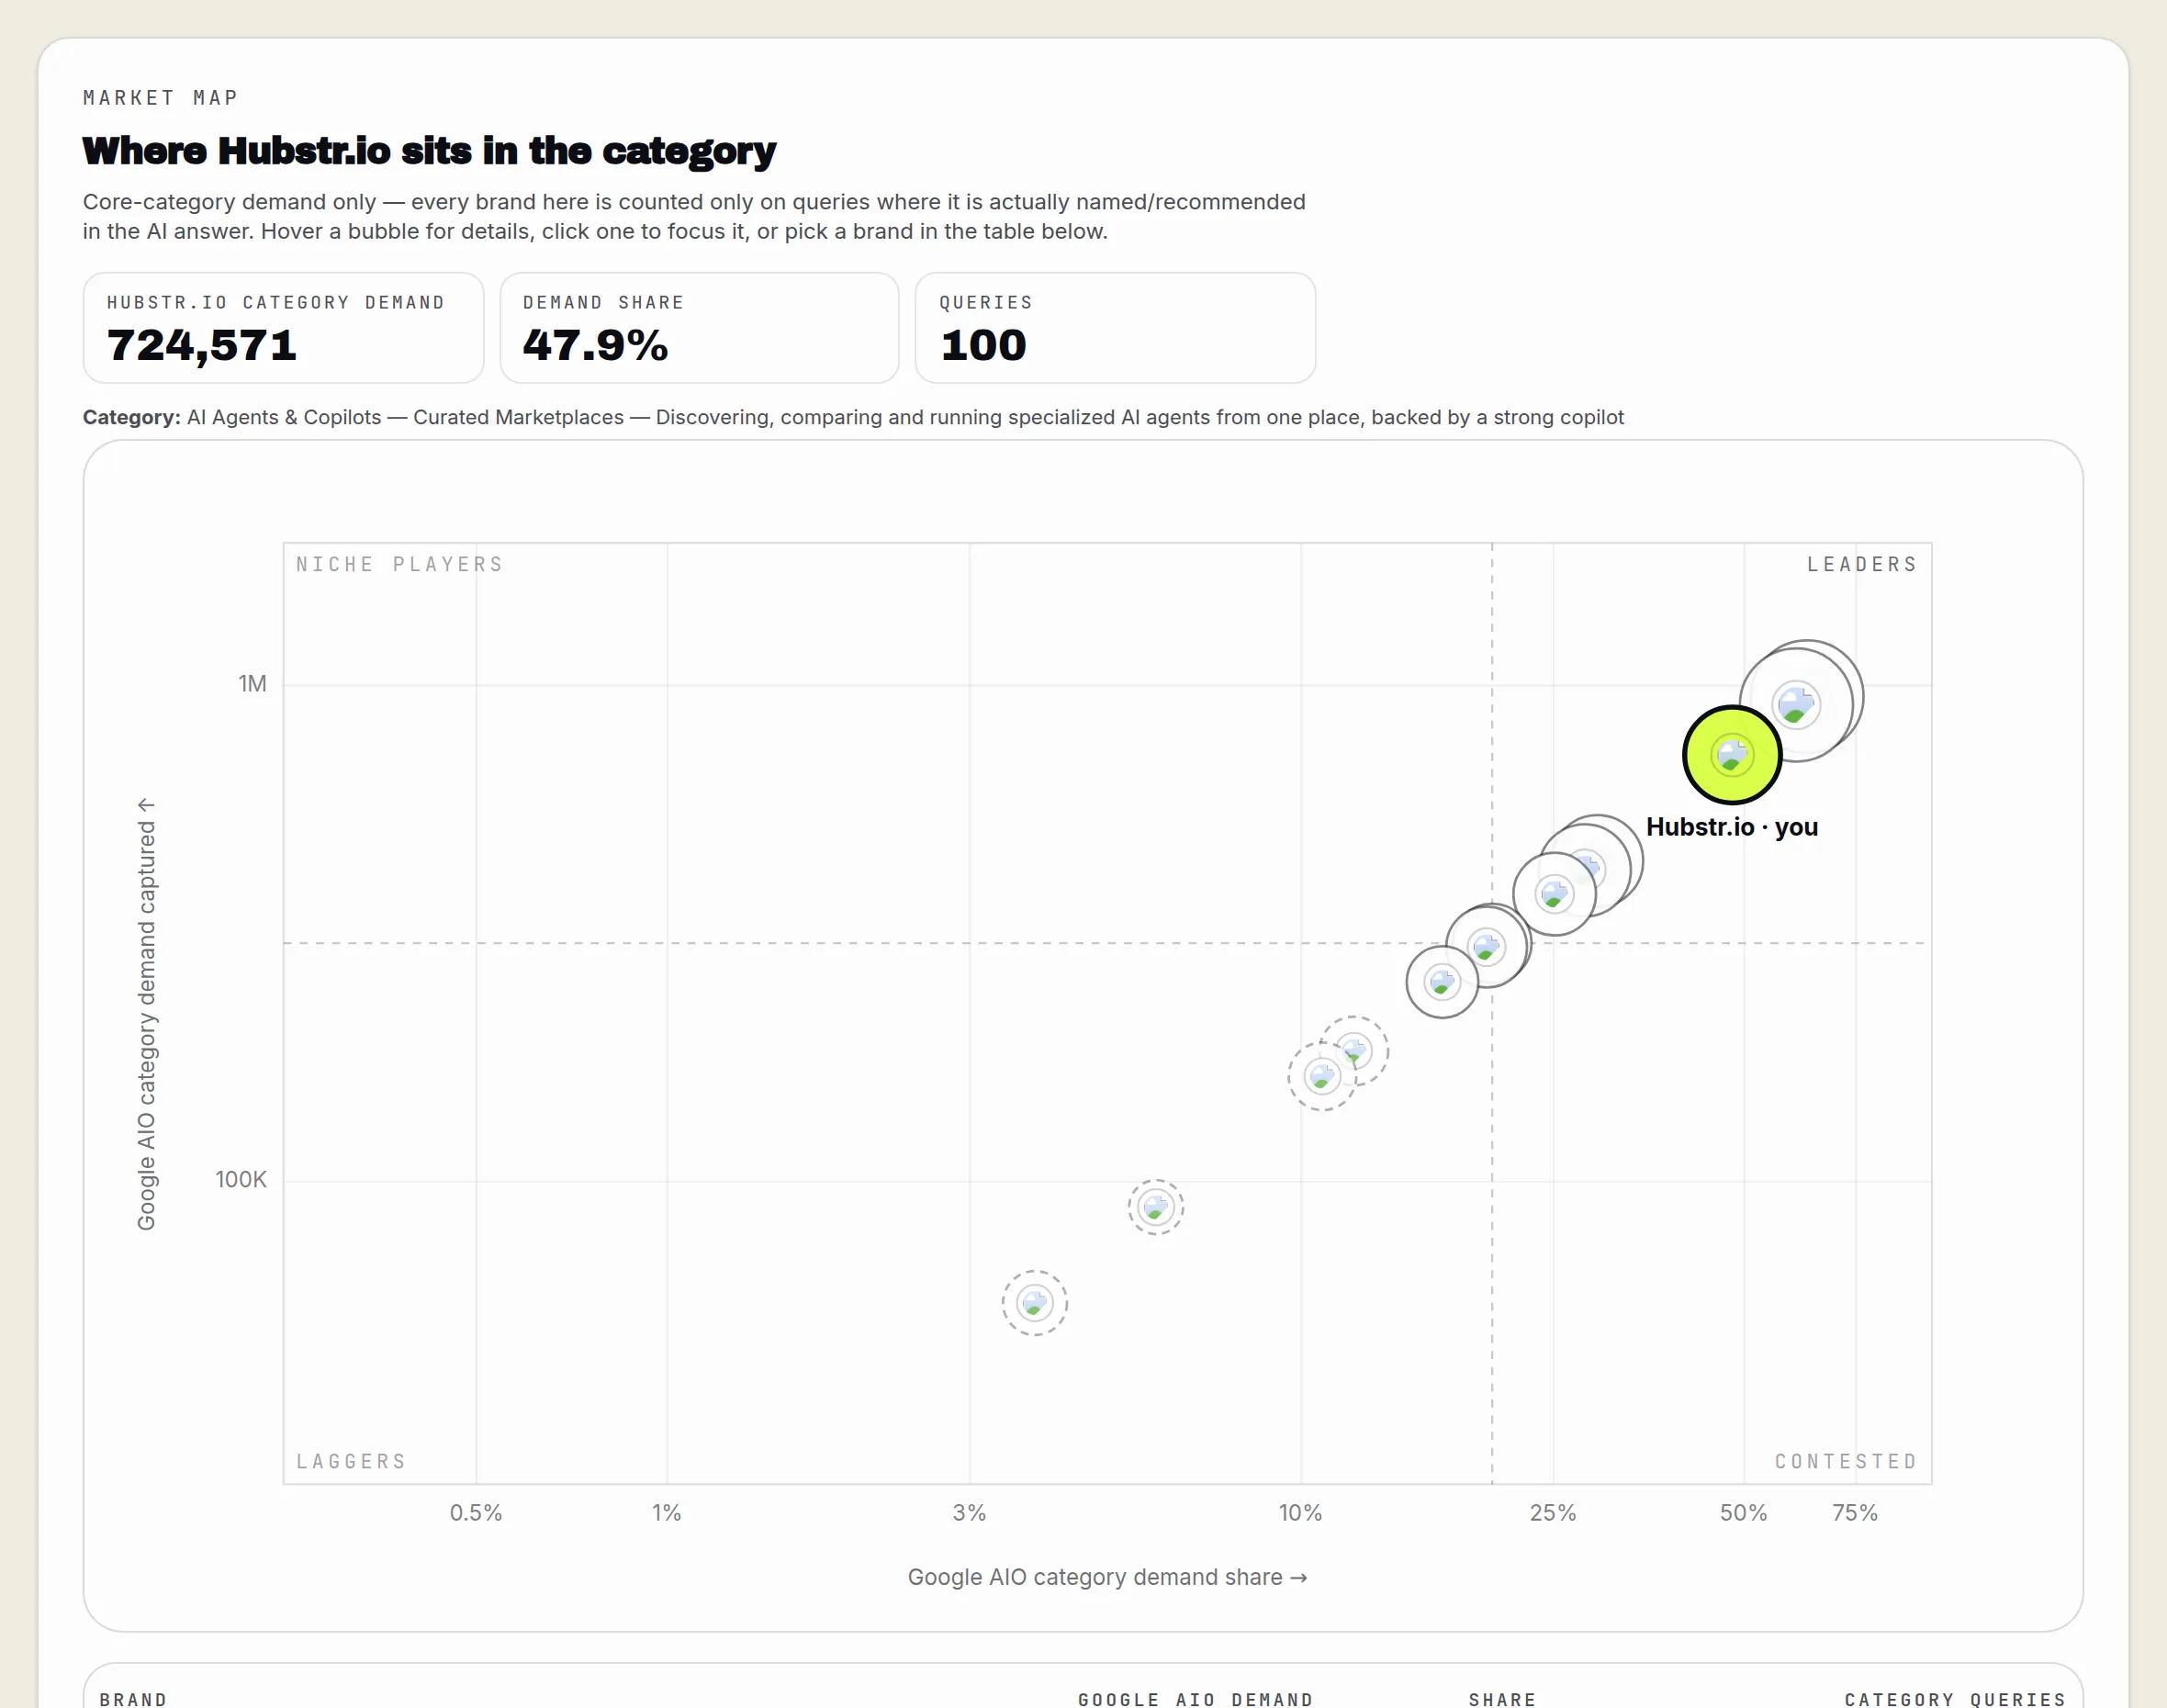
Everybody an assistant names for the questions your buyers ask, not only the rivals you would list yourself. GEO MarketMap puts your project and every brand the answers name on one map, sized by how much of the niche's demand each captures, so you can see where you sit, how big AI search is around you, and who is moving.

- Competitor A31 of 40
- Competitor B22 of 40
- A marketplace you never listed17 of 40
- You9 of 40
Every brand the answers name, on one map
Sized by how much of the niche's demand each captures. You lit in lime; the rivals you never listed beside the ones you did.
Three things nobody else shows you
- Rivals you did not know about
A marketplace, a review site, a brand from the next niche: whoever the answers name is on the map, listed by you or not.
- The size of AI search around you
How many questions, how much demand behind them, and what share of that demand each brand is named on.
- Every rival's movement, tracked
The same questions re-asked on a schedule, every brand kept as a series, so a rival that moved is a rival that published.
One niche, as the map reads it
| Brand | Named on | Share of measured demand | Since last month |
|---|---|---|---|
| Competitor A | 31 of 40 questions | 34 of 100 | up 3 questions |
| Competitor B | 22 of 40 questions | 21 of 100 | flat |
| A marketplace nobody listed | 17 of 40 questions | 15 of 100 | up 5 questions |
| You | 9 of 40 questions | 8 of 100 | up 2 questions |
Four of the eleven brands on one map. A share is of the demand the map measured, never of a market. Figures shown are an example of the shape, not a customer's numbers.
Why is my competitor list wrong?
Because it is the list of who sells what you sell, and the answers do not care. An assistant asked for the best option in your category names whoever it has read most about: a marketplace, a review site, an adjacent product, a brand from the next niche over. Those take the place you wanted, and none of them are on your list.
The detail+–
The map starts from the answers rather than from your list. Every brand named for your questions is placed, and only on the questions where it is actually recommended, so a giant named once does not swamp a rival named on half of them. According to the Princeton and Georgia Tech researchers who measured generative search, visibility "varies across domains, underscoring the need for domain-specific optimization methods", which is why the map is drawn per niche, from its own questions (10 to start, up to 50), rather than from a category average.
How big is AI search around my project?
The map states it in the questions it measured: how many questions, how much search demand sits behind them, and what share of that demand each brand is named on. A share is never printed without what it is a share of.
The detail+–
That is enough to decide where to move. A niche where three brands hold most of the demand is a niche you enter through the questions nobody holds yet; a niche with nobody dominant is one whose head you can take.
Can I watch the rivals move?
Yes. The same questions are put to the same assistants on a schedule, and every brand's count is kept as a series, so the map shows who gained a question and who lost one. A rival that starts appearing on questions it never held is a rival that published something, and that is the moment to look at what.
The detail+–
You can add a brand the map found to your project's market in one press, or start a project on it to read its site the way yours was read.
Why does being named matter more than a ranking?
Because the click is going away. According to the Pew Research Center, which tracked 68,879 Google searches by 900 adults in March 2025, people clicked a traditional result in 8% of searches that showed an AI summary against 15% of those that did not, and clicked a link inside the summary itself in "1% of all visits".
The detail+–
So the answer is increasingly the destination. Their report is titled "Google users are less likely to click on links when an AI summary appears in the results", and 58% of the 900 people in the study saw at least one summary that month. Ranking third for a question whose answer nobody clicks through from is a worse position than being the brand that answer names, and the map is drawn from the names.
Also asked
- Is the map built from Google or from the assistants? +
- From both. Google's own AI answers place the brands on the map first; ChatGPT, Perplexity and Gemini are asked the same questions, so a brand named by one assistant and not another is shown as exactly that.
- Can I remove a brand I do not consider a rival? +
- Yes, and it stays visible as context. Dropping a brand from your list does not remove it from the answers; the map keeps showing who the assistants recommend, and your list decides who the agent plans against.
- How many rivals does it track? +
- Every brand the answers name is placed on the map, and the set you keep is measured on a schedule. A rival you add by hand is measured the same way as one the answers found.
Last updated 3 September 2026

Become the brand AI recommends.
Start with the free check. Your web address and nothing else.